Turn Data into Stunning Charts in Seconds

Turn Data into Stunning Charts in Seconds

Instantly create a custom chart or diagram with AI.

Transform data into beautiful visuals and powerful insights with VibeChart.

Instantly create a custom chart or diagram with AI.

Transform data into beautiful visuals and powerful insights with VibeChart.

Japan population decline in 30 years
Pie chart from the image
Users by age group
Monthly Revenue, Expenses & Profit chart
Avg purchase heatmap by age & income

Trusted by 500+ business & research teams

Built for Speed, Flexibility & Precision

Text-to-Chart interface

Create and customize over 40 types of charts using plain language and natural data queries.

Built-in data engineer

Clean, transform, and extract insights from messy data with smart, instructable tools.

API & MCP access

Access high-speed, reliable chart generation via API with 99.9% uptime and sub-2-second response time.

Share your work anywhere

Graphs made in VibeChart are tailored to be shared.
Export it as image, link or embedded code anywhere.

Graphs made in VibeChart are tailored to be shared. Export it as image, link or embedded code anywhere.

Powerpoint

Powerpoint

Powerpoint

Notion

Notion

Notion

Email

Email

Email

X

X

X

API

API

API

Keynote

Keynote

Keynote

Slack

Slack

Slack

Whatsapp

Whatsapp

Whatsapp

LinkedIn

LinkedIn

LinkedIn

MCP

MCP

MCP

Google Slides

Google Slides

Google Slides

Airtable

Airtable

Airtable

Links

Links

Links

Substack

Substack

Substack

Web embed

Web embed

Web embed

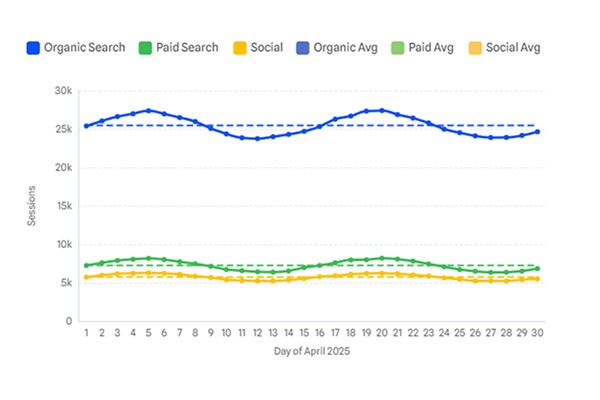
See VibeChart in action

Various charts generated across different domains

Data Analytics

Product Management

Surveys

Consulting

Accounting

Investment

Quality Assurance

Data Analytics

Product Management

Surveys

Consulting

Accounting

Investment

Quality Assurance

Data Analytics

Product Management

Surveys

Consulting

Accounting

Investment

Quality Assurance

Start Visualizing Smarter

Start Visualizing Smarter

Stop wasting time on manual charting.